Each component can run in modeled mode (build from detailed inputs) or decision mode (plug in your numbers directly).
01
Product Data
SKU-level pricing, COGS, and sales distribution by new vs. repeat customers. Changing your product mix dynamically updates AOV and margins.
Drives AOV + COGS
02
AOV Modeling
Modeled: blended discounts, refund allowance, shipping revenue, units per transaction. Or plug in a decision AOV and skip the detail.
Modeled or Decision
03
Variable Costs
Unit COGS (derived from product mix), fulfillment and carrier fees per order, and payment processing (2.9-4% depending on BNPL volume).
Auto-calculated from product data
04
nCAC + Efficiency Decay
Model acquisition cost from Meta/Google CPMs, CTRs, and conversion rates. Apply a decay factor (0.15-0.4) to forecast how nCAC worsens as spend scales.
The lever most brands ignore
05
Retention Data
Map repurchase rates across 12-month windows. Or use Shopify's return customer rate for a simpler view. Retention compounds - this is where growth lives.
12-month repurchase windows
06
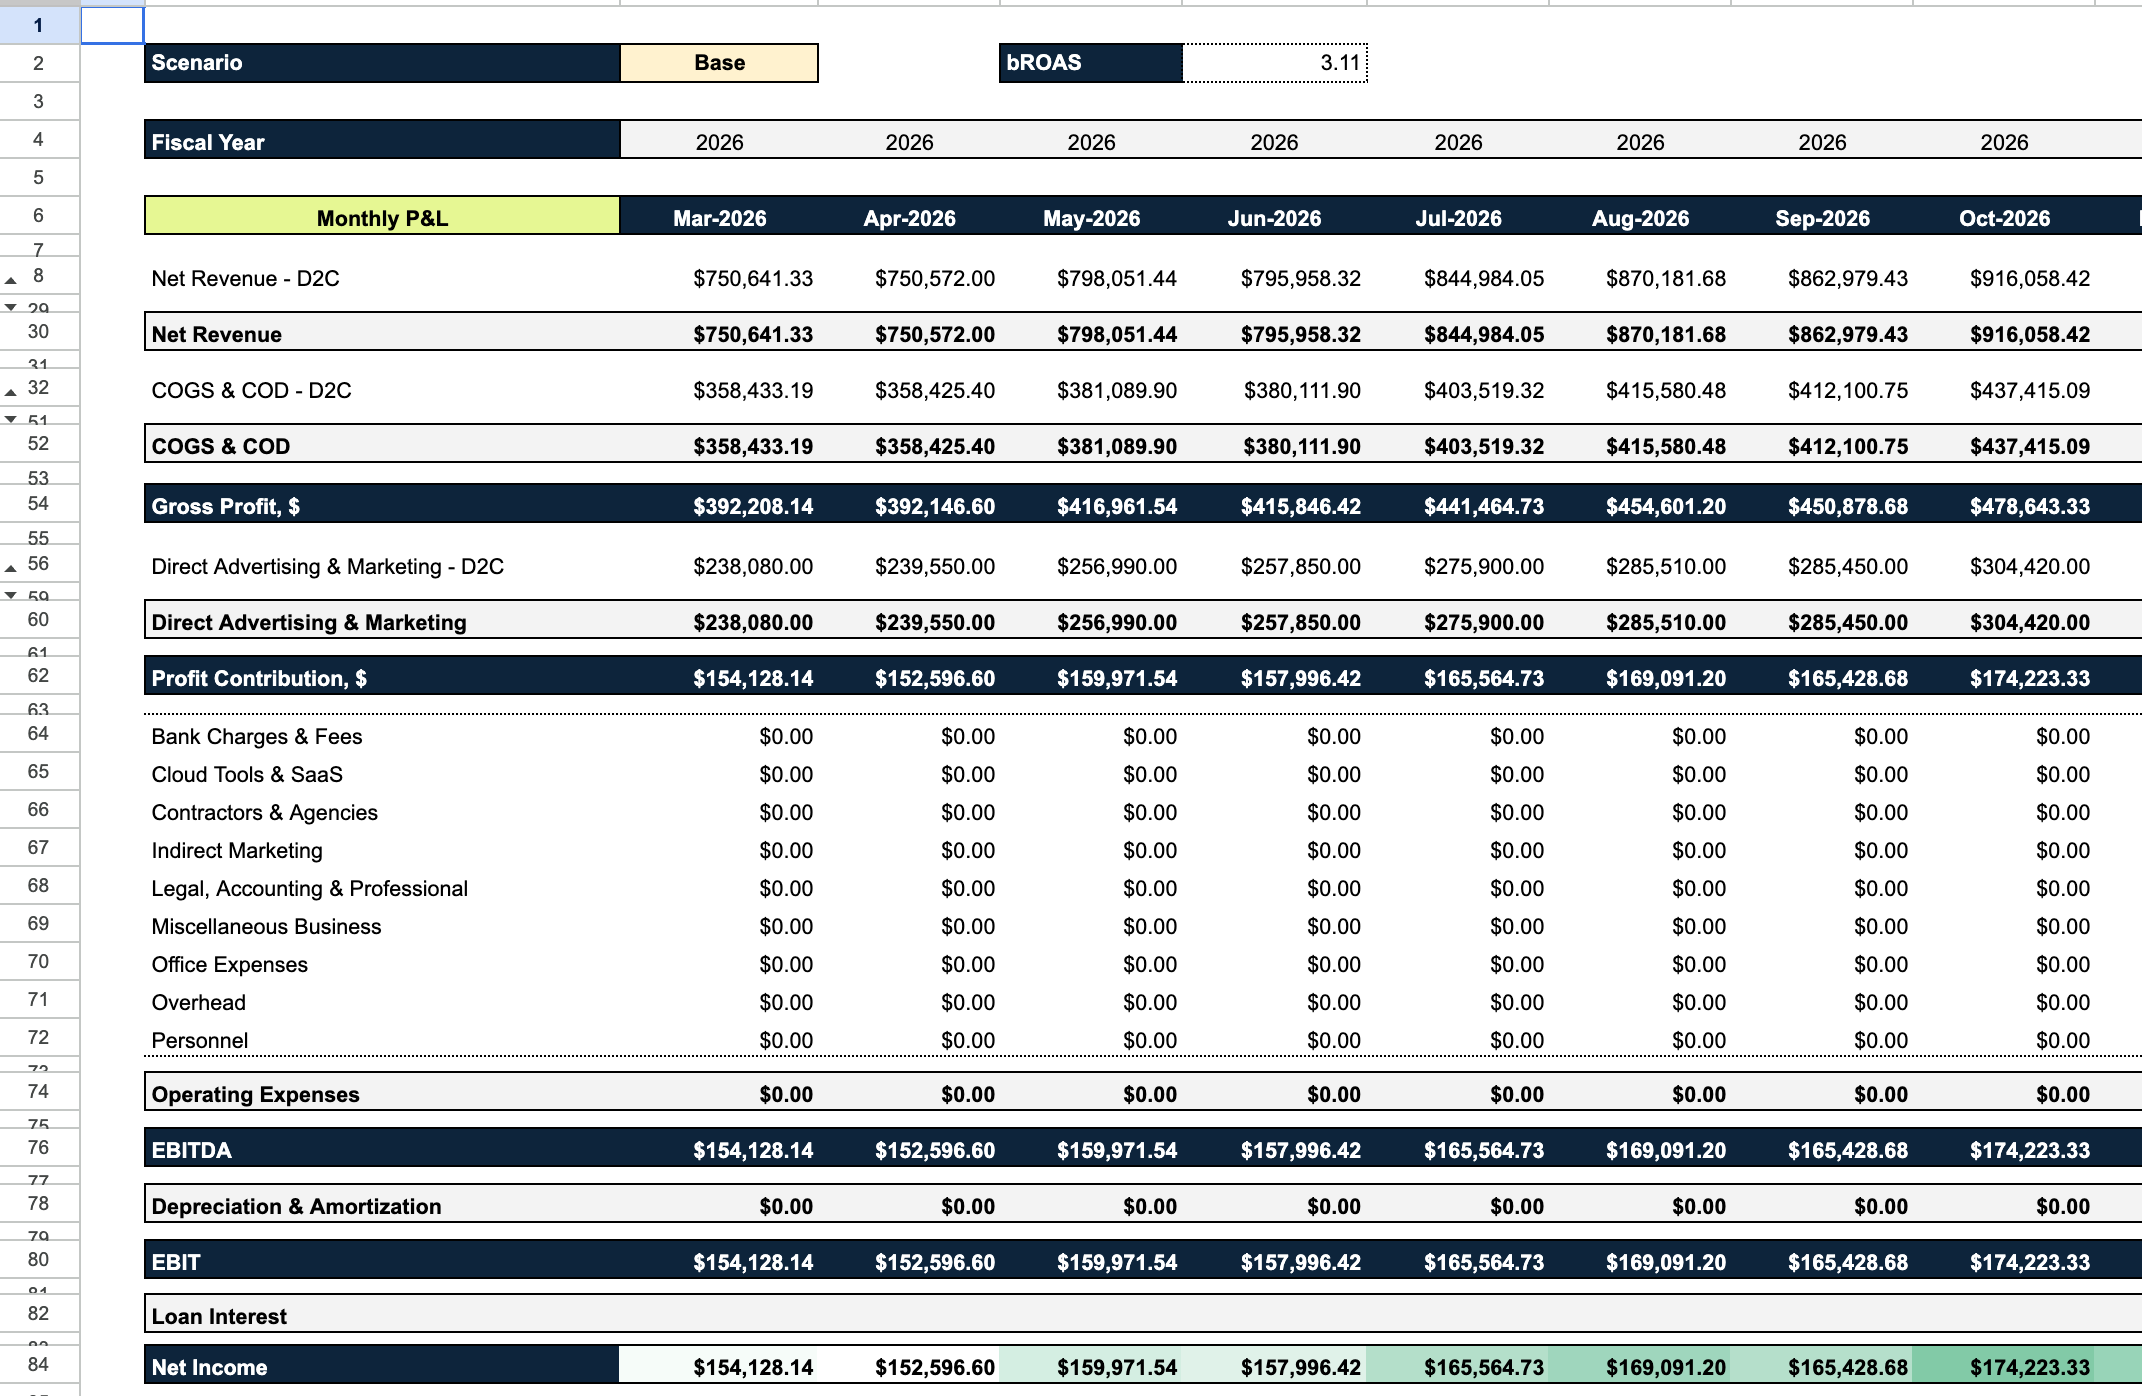
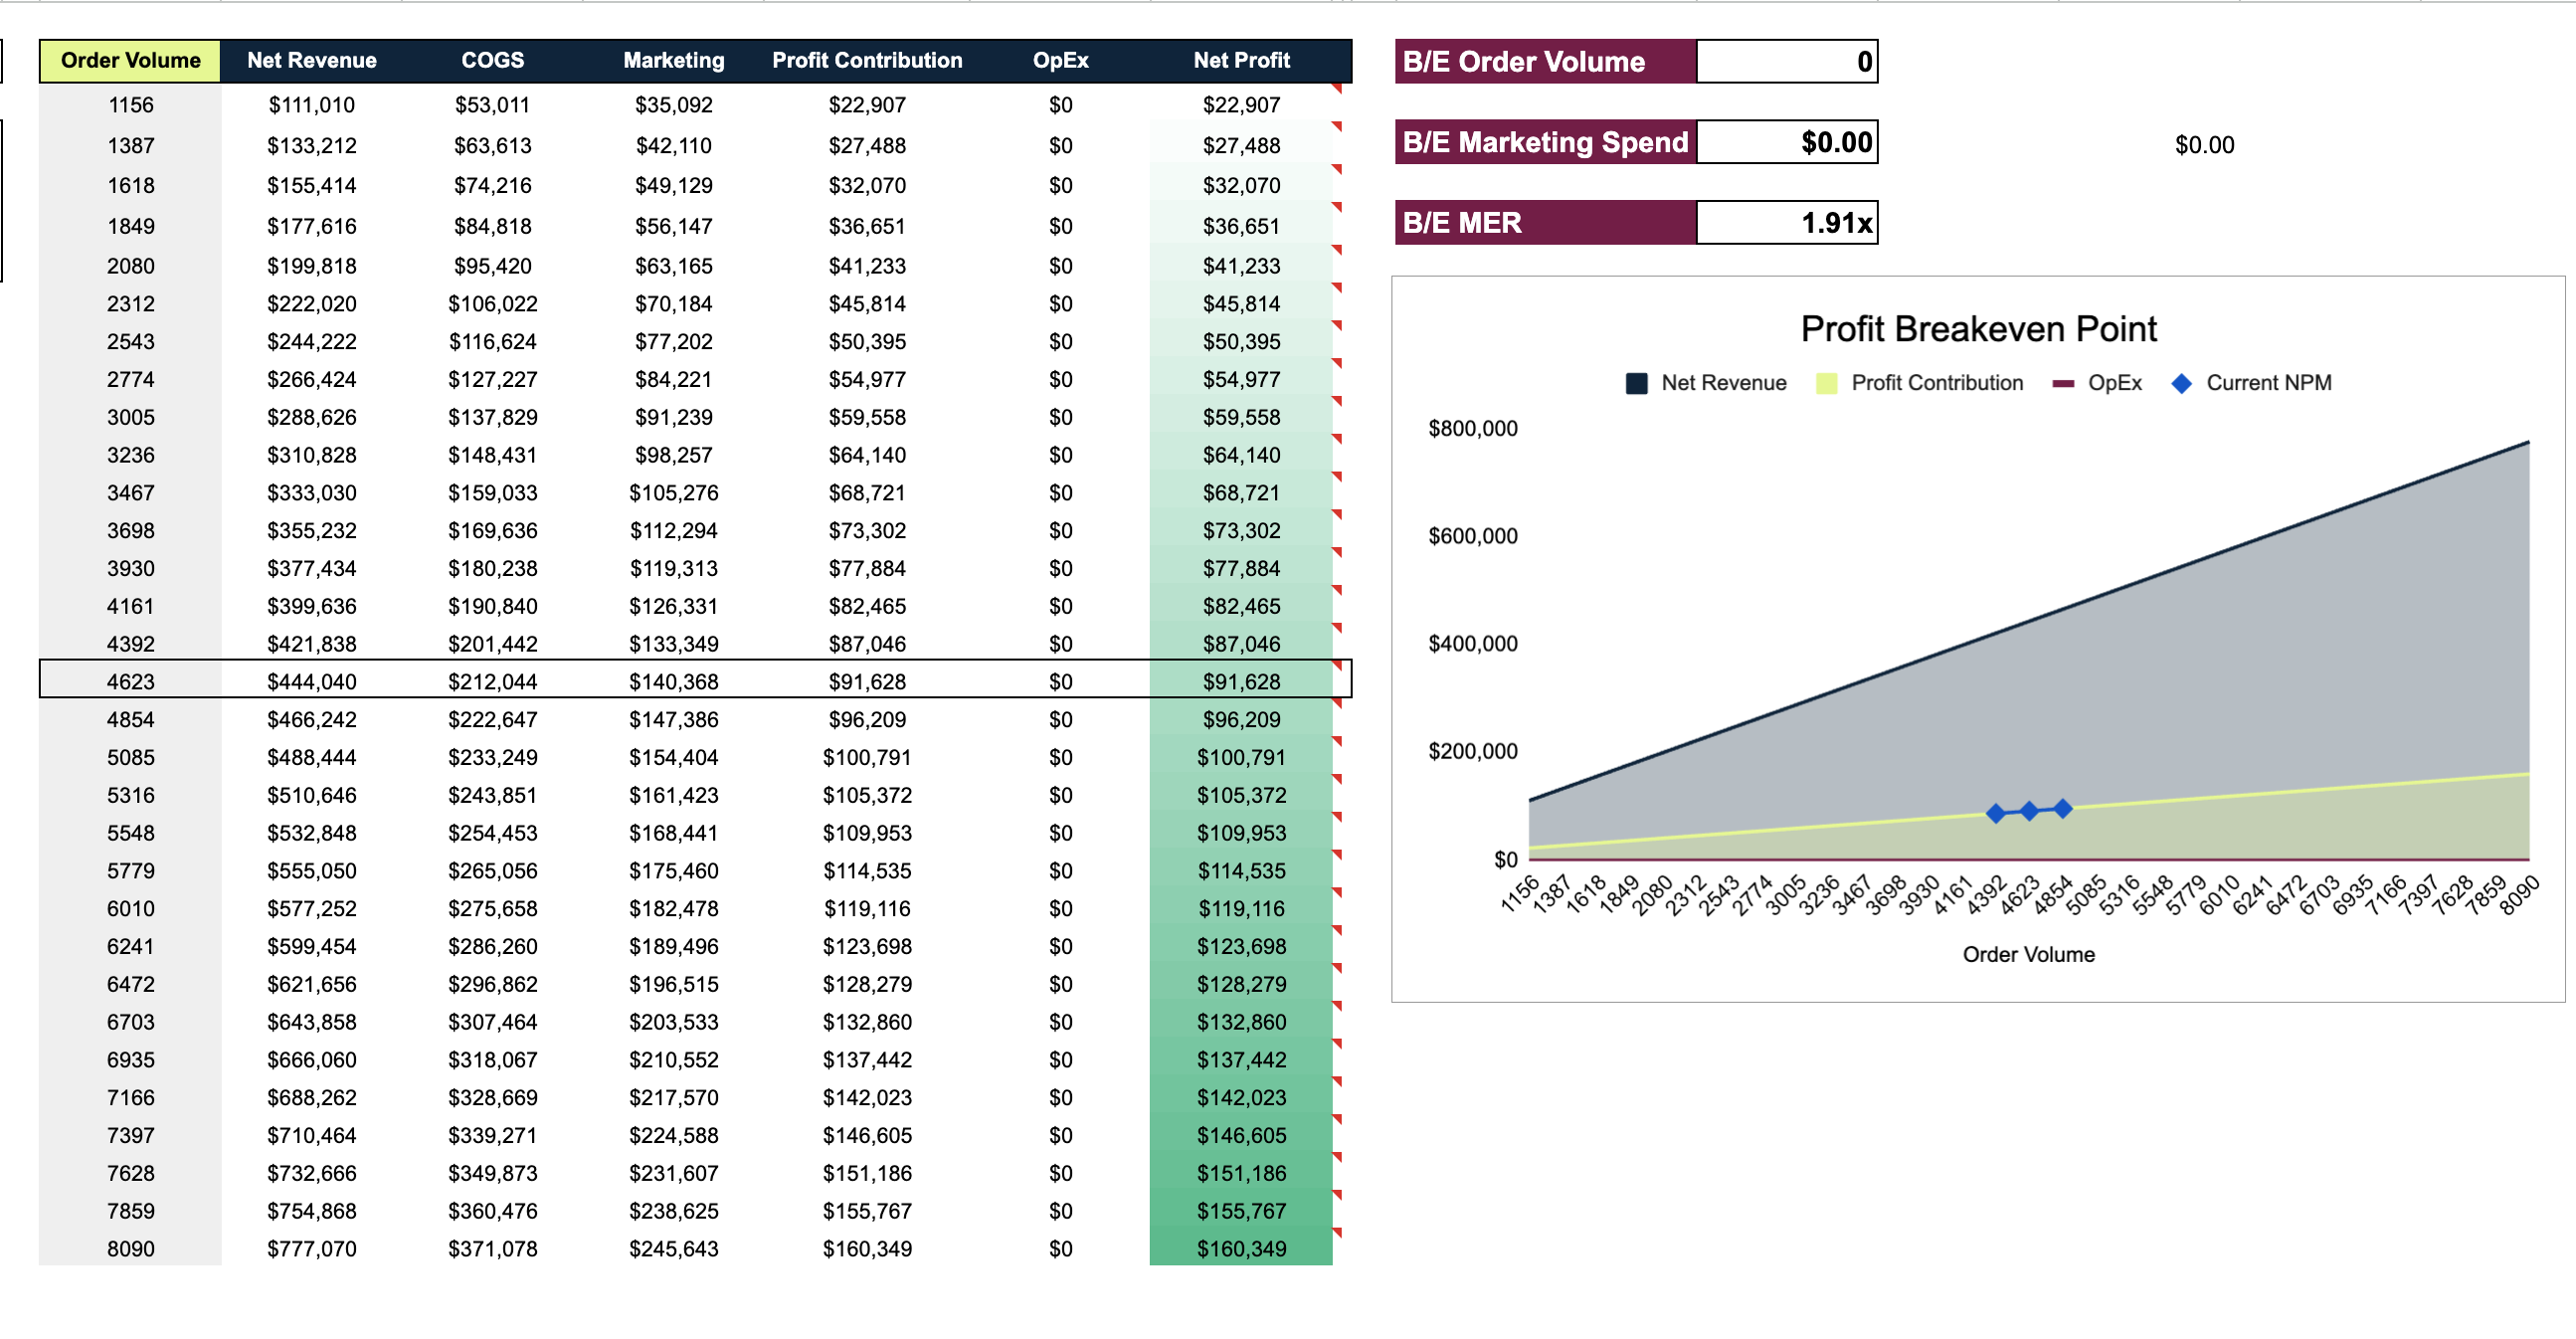
Daily Revenue Model
Combines all five inputs into daily projections. New + repeat customer orders, monthly P&L, base/worst/best scenarios, and a 13-week cash flow forecast.
P&L + 13-week cash flow